
Spearmans non parametric correlation analysis in SPSS
The Spearman's is also referred to as a rank-order correlation because it is applied to ordered data that do not meet the conditions necessary to use Pearson's correlation. This is a non-parametric test and measures the strength and direction of the association between two variables, where at least the two variables are measured on an ordered scale. The Spearman's correlation is denoted the later rho. The test is applied to ordered data or continuous data that do not meet the assumptions of normality. Other tests that can be applied to assess the association of nonnormal or ordered data are Goodman and Kruskal's gamma and Kendall's tau-b tests. Before going through the steps, it is important to ensure that your data meets the following assumptions.
Assumptions
Assumption 1: The data should be measured on either interval, ordered or ratio scale. Data on a Likert scale are considered ordinal and therefore Pearson correlation is appropriate for use when your variables are recorded on a Likert scale.
Assumption 2: Monotonic relationship. The two variables should indicate some trend that indicates an association between the variables. i.e either the two variables will increase together or one will increase as the other decreases. A scatterplot can be used to check this assumption.
As such, monotonicity is not an assumption of Spearman's correlation. However, you would not normally want to pursue a Spearman's correlation to determine the strength and direction of a monotonic relationship when you already know the relationship between your two variables is not monotonic. Instead, the relationship between your two variables might be better described by another statistical measure of association. For this reason, it is not uncommon to view the relationship between your two variables in a scatterplot to see if running a Spearman's correlation is the best choice as a measure of association or whether another measure would be better.
Case:
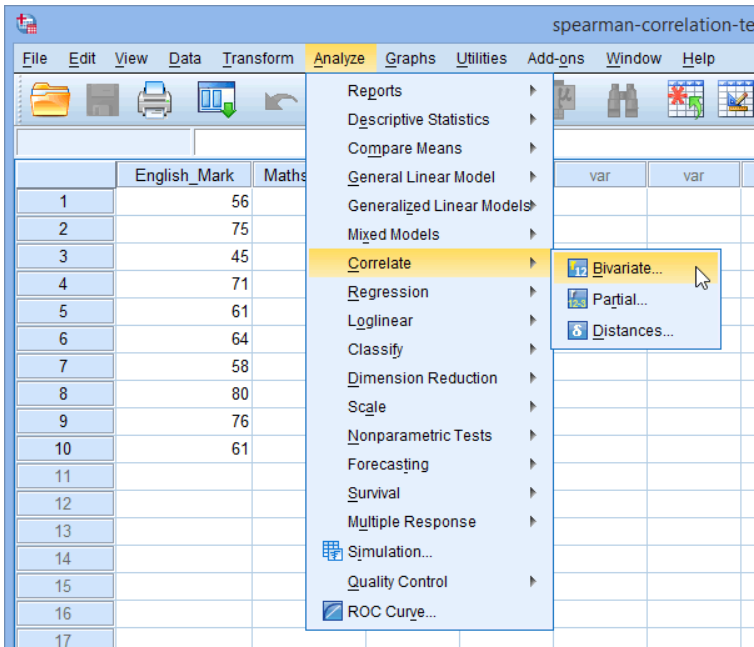
We might be interested in testing whether English score is associated with Math score. To analyze your data in SPSS follow the steps presented below.
Step 1: Click Analyze > Correlate > Bivariate as shown in the screenshot below.
Step 2: The Bivariate correlation dialogue box will be presented. Transfer the two variables into the variables box as shown below.
Step 3: Uncheck the Pearson box and Check the Spearman box, see the box below.
The output for the sample data is shown below.
The general interpretation of the results would as described below.
A Spearman's correlation was run to determine the relationship between students' English and maths exam score. There was a strong, positive correlation between English and maths marks, which was statistically significant (rs(8) = .669, p = .035).


Comments (0)