
Measures of relative standing using Z score and Boxplot
The Z score
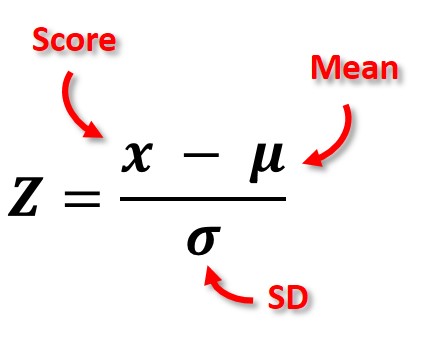
The z-score is a measure of how many standard deviations a data point falls from the mean. Z-scores are typically rounded to 2 decimal places.
The formula for the z-score is (data point - mean)/(standard deviation)
Example of a z-score calculation
Example: Suppose the mean height of students at the college in inches is 57” with a standard deviation of 2”. What is the z-score for a height of 54”. Using the formula we get (54-57)/2. This equals -3/2 which is a z-score of -1.5.
An Unusual statistical event
For a typical distribution, the majority of z-scores will be between -2 and 2. If a z-score is lower than -2 or greater than 2 then we consider it unusual. Unusual in is case means it is not what was expected. For example, suppose the average height of men is 69.7 inches with a standard deviation of 4 inches. We go out an measure 1 man at random and we just happen to select LeBron James. His height is 79.92 inches. If we calculated his z-score it would be considered unusual let's test that theory
z-score = (79.92-69.70)/(4) =
this gives a z-score of 2.55 which by definition is unusual. This makes sense because LeBron is a professional basketball player and his height is not what we expect of all men.
Notice that when the data point falls below the mean the z-score is negative. If the data point is above the mean then the z-score is positive.
Comments (0)