
About percentiles in statistics
Percentile Notation
Percentiles separate the data into 100 different parts
Pk (0 < k < 100) is the kth percentile.
P50 is the 50th percentile = Q2 = median.
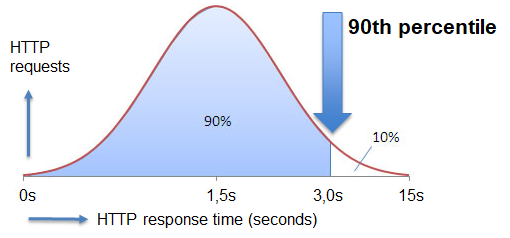
P90 is the 90th percentile. This number separates the bottom 90% of the data from the top 10%.
Percentile Calculations
- 1. Order the n values from least to greatest
- 2. The index i is found by i=(k/100)*n
a) if i is a whole number you average the ith value and the next value to get Pk
b) if i is a decimal ROUND UP to get the index of Pk
Example: Sarah's professor posts a list of grades, without the names, on the blackboard. There are 15 students in the class and 15 grades on the board.
The grades are: 85, 34, 42, 51, 84, 86, 78, 85, 87, 69, 94, 74, 65, 56, 97.
Find the 90th percentile.
The total number of values in the data set is 15.
1. Order the grades from least to greatest: 34, 42, 51, 56, 65, 69, 74, 78, 84, 85, 85, 86, 87, 94, 97.
Index the data
1 2 3 4 5 6 7 8 9 10 11 12 13 14 15 34 42 51 56 65 69 74 78 84 85 85 86 87 94 97
P90 = (90/100)*15 =13.5
Since this is a decimal we round up to 14. Look for what number is at index 14 and this is the 90th percentile, in this case 94.
Comments (0)