
The Empirical rule in Statistics
The Empirical Rule and Normal Distributions
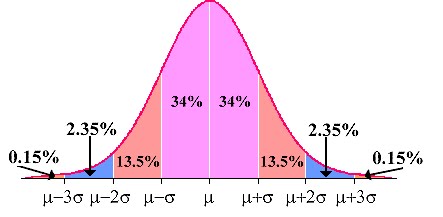
Normal distribution
The normal distribution is important because many variables studied are normally distributed. For example reading ability, height and weight, to name a few. Knowing data is normally distributed means you can use specific statistical tests.
Even better, the tests work pretty well even if the distributions are only approximately normally distributed (meaning sort of close to normal but may be off a little).
You have probably heard teachers say they grade on a curve....but what does this mean? Let's say a teacher gives a test to a class of students and the mean (or average) score is 80 and the standard deviation is 5. According to the empirical rule, 68% of the students should fall within ± one standard deviation of the mean. If you look at the curve, those students will get C's (C is meant to show "average performance". )
Move to two standard deviations away from the mean, and you have the B's to the right and the D's to the left. Move to three standard deviations from the mean and you have the A's to the right and the F's to the left.
You can set it up as a grading scale:
100 - 91 = A 90 - 85 = B 84 - 76 = C 75 - 70 = D 69 - 00 = F
The key to grading on the curve means you will always have at least one A and one F and the majority of a class will be C's. And the issue of someone "ruinung the curve" means a student gets such a high score that the rest of the curve will be skewed to the right, meaning the range for C's and D's will be much higher than the usual 60 - 70%.
Say you are in a class of 17 students and the mean and standard deviation follow the curve above. 17 x 68% = 11.56 or 12 students will get a C and B's, D's, A's and F's will be spread among 5 students.
Depending on the instructor's preferences, usually, it works out to one F, one A, two B's and one D.
Comments (0)