
Analysis of one-way ANOVA in SPSS Statistics
The One-Way ANOVA model is SPSS
This model (the one-way ANOVA) is used to determine if there is a significant difference between the means of two or more independent groups given a continuous dependent variable. The independent variable in a one-way ANOVA is called a factor and the categories of the variable are called factor levels. You will rarely see a comparison being made between two categories but it is a common practice especially in coursework activities to see three or more groups. For example, one might be interested in testing how the students perform in an exam based on their anxiety level (low, medium and high-stressed). Remember that you can differentiate which group is different from which group when you use a one-way ANOVA. Thus, it is an Omnibus test.
Before conducting an analysis using a one-way ANOVA, it is important to assess whether your data meets the following assumptions.
Assumption 1: The dependent variable should be measured on a continuous scale, i.e the variable should either interval or ratio. The assumption can be met by ensuring that appropriate data measurements are used when collecting the data.
Assumption 2: You should have at least two categories for the independent variable. Generally, people will always use the independent two-sample t-test when they have two groups.
Assumption 3: Your observations must be independent. The observations for each group must be independent.
Assumption 4: No significant outliers. Outliers can reduce the validity of your results. The outliers can be detected by use of a Boxplot, a boxplot of each of the categories and the dependent.
Assumption 5: The distribution of the dependent variable for each of the category of the independent variable should be approximately normal. The Shapiro-Wilk normality test can be used to test the assumption in SPSS.
Assumption 6: The homogeneity of variances assumptions. This assumption can be tested in SPSS using the Levene's test of homogeneity of variances.
Remember that the first three assumptions are related to the data collection procedures.
Case:
The following procedures relate to an analysis which was conducted to determine the time that the students took to complete a set of problems based on the course level. Therefore, there are three-course levels: beginner, intermediate and advanced course level. Follow the following procedures to run the data analysis in SPSS.
Step by Step Analysis of one-way ANOVA data in SPSS
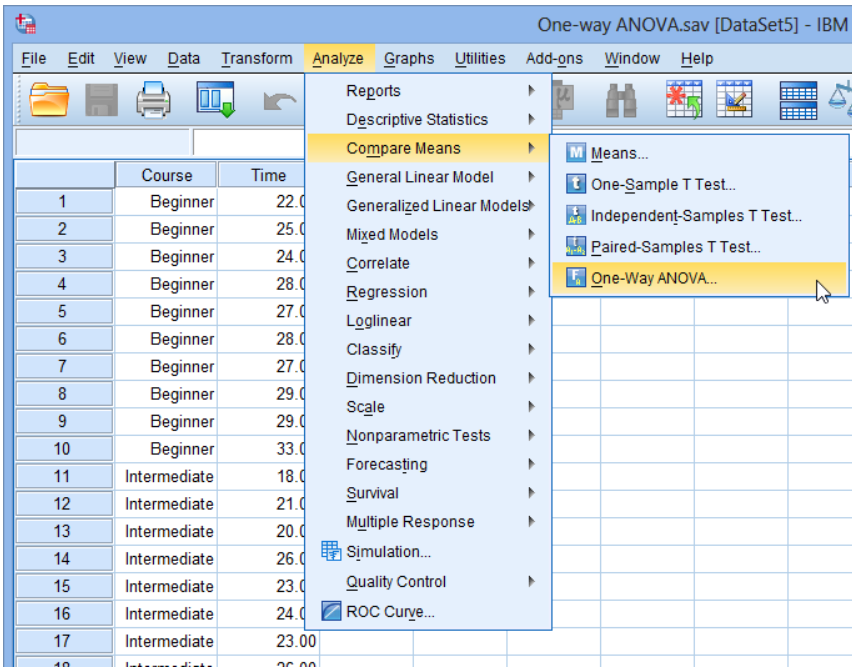
Step 1: Click Analyze > Compare Means > One-Way ANOVA, The screenshot is shown below
Step 2: In the one-way ANOVA dialogue box transfer your dependent variable to the dependent list and the independent variable to the factor box as shown below.
Step 3: Click the Post Hoc button and check the Tukey box and click continue.
Step 4: Click the options button to check the descriptive checkbox as shown below.
Step 5: Click Continue and click OK to get the one-way ANOVA output in SPSS.
The following output will be generated for our analysis.
Descriptive statistics
The descriptive statistics table displays the means and the standard deviations by category. The statistics for the combined sample are also displayed.
The ANOVA table
Read the significance of the effect from the ANOVA table depending on your alpha level. For this case, the test statistic is significant at an alpha of 0.05. F(2,27) = 4.467, P = 0.021.
With these results, we do not know which groups are different from which groups, thus it is necessary to conduct multiple comparisons of groups.
Multiple comparison results.
The multiple comparison results using the Tukey test are displayed below, this can be used to check which groups have significantly different means from each other.
We can see from the table below that there is a statistically significant difference in time to complete the problem between the group that took the beginner course and the intermediate course (p = 0.046), as well as between the beginner course and advanced course (p = 0.034). However, there were no differences between the groups that took the intermediate and advanced course (p = 0.989).


Comments (0)